
Dating Analytics
Are first impressions really the first impression?
Speed dating is a process meant to encourage open-minded romance based on first impressions and impulsivity. In one night of speed dating men and women have brief introductions with many different potential dates and rank their partners based on their quick conversations. The assumption behind the process is that the short amount of time spent with each person is just enough to establish mutual interest and lingering intrigue. After the process is over, the men and women have the opportunity to reach out to dates they found desirable and continue their newfound connection. The stigma behind speed dating is that any successful match made is random or even serendipitous. However, when the process is studied, including participant perceptions, reactions, desires and characteristics, clear patterns arise.
Raymond Fisman, professor of behavioral economics and Boston University, conducted one trial set to understand these possible participant patterns and trends expectations in 2005. His experiment was designed to measure real-world decision-making influencers through a carefully constructed dating process. Subjects from the graduate program at Columbia University gathered at a local bar and restaurant where they were split up by gender and the men rotated to a different woman after 4-minute intervals. Prior to speaking with potential dates, each subject filled out pre-event surveys. They were asked a variety of questions about their physical characteristics, interests and were asked to rank desired attributes in potential matches. After the process was over, they filled out a post-event survey that reflected on the process and asked them to rank levels of certain qualities they saw in each partner.
When searching through the data and the conclusions made by Raymond and his team, there were a few questions I wanted to answer that had not yet been explored. Deciding whether you click with someone in 4 minutes is a daunting task that is influenced by many things. Through my reanalysis of his data, I considered Race, Age and Gender disparities between successful matches and the level of importance placed on different attributes of a potential date.
I sought to answer four questions:
- Did race factor into establishing a match?
- Do different age groups want different things from their potential partners?
- Do men and women want different things from their potential partners?
- What actual traits about a person made them desirable?
The first pieces of the data that I explored dealt with the race of daters. The essential pieces of data recorded that allowed me to look for patterns were; the race of the dater and their partner, if they were the same race as their partner and a ranking from 1-10 of how important it was to be the same race as their match. In order to answer the question if race influenced matches I first analyzed the relative importance of matching with someone that is the same race for each of the different races. In the data set, race is indicated by a number between 1-6, ranging in order as Black/African American, Caucasian, Latino, Asian/Asian American, Native American and Other (there were no Native Americans participants). Participants were asked how to rank on a scale from 1-10 how important it was to them that they match with someone their similar race. As you can see from the graph below, Caucasians had the highest level of importance at an average ranking of 4.12 points. Black and Asian participants followed with an average ranking of 3.32 and 3.08 points and Latinos averaged the lowest preference toward the same race with a average ranking of only 2.82. Another interesting finding was that women of every race except Asian had a higher average level of preference than men. This correlates with the findings from Fisman, who claims that women with a “yes rate” of 38% are 14% more likely to accept a date of the same race.
Knowing this, I wanted to look further at how many pairs of same race couples were matched throughout the entire process. At first, I tried to answer this by calculating the number of times each race matched with a partner of their same race. Caucasians with another Caucasian 478 times, Asians matched 62 times, Latinos matched 12 times, Blacks matched 10 times and “Others” matched 4 times. This showed me that Caucasians matched with each other much more frequent than any other race. It also represented the only correlation I noticed between preferred same race and actual matches between the same races. Caucasians had the highest preference for a match with the same race and matched with them the most often. However, simply looking at the number of matches that occurred is misleading due to the uneven representation of races in the study. Caucasians made up roughly 66% of the entire study. Therefore it is helpful to understand the percent of times each race matched with the same race compared to all of their matches throughout the whole process. Caucasian participants matched with other Caucasians 61.44% of the time, Asians matched with other Asians 23.48% of the time, Black’s matched together 11.76% of the time and Latino participants matched at only 9.92%.
Though one could argue that there is a correlation between Caucasians matching and their higher preferences to match with the same race, their dominating presence in the study proves as a limitation to understanding this question fully.
Comparing the number of matches made between each race was a way to combat this limitation and understand the dynamic between races more clearly. I did this by creating a chart that represents the frequency at which observed matches between races compared to the number of times we could expect matches to be made if matches were distributed equally. This takes away the bias caused by the uneven representation of races within the population. In doing so, I was able to see that Caucasian daters did have a stronger rate of selection toward members of their own race than was expected. Furthermore, we observed less matches between Caucasians and all other races than was expected. This proved to be the strongest suggestion of a correlation between Caucasians’ rated importance of matching with the same race and actually selecting their race. As you can see below, in all cases except those that identified with the “Other” category, more matches were observed than expected for all cases of same race matches. Matches between Whites and Asians were observed the least amount of times compared to expected, which is an interesting finding considering Asians were the next highest represented race in the study compared to Caucasians.
Overall, while there could be a correlation between all white matches and Caucasians’ high preference for matching with the same race, low participation from other races in the study overall makes the data about matches between races less credible. However, it is clear that women have a higher preference for matching with the same race. This finding led me to question what else women preferred over men.
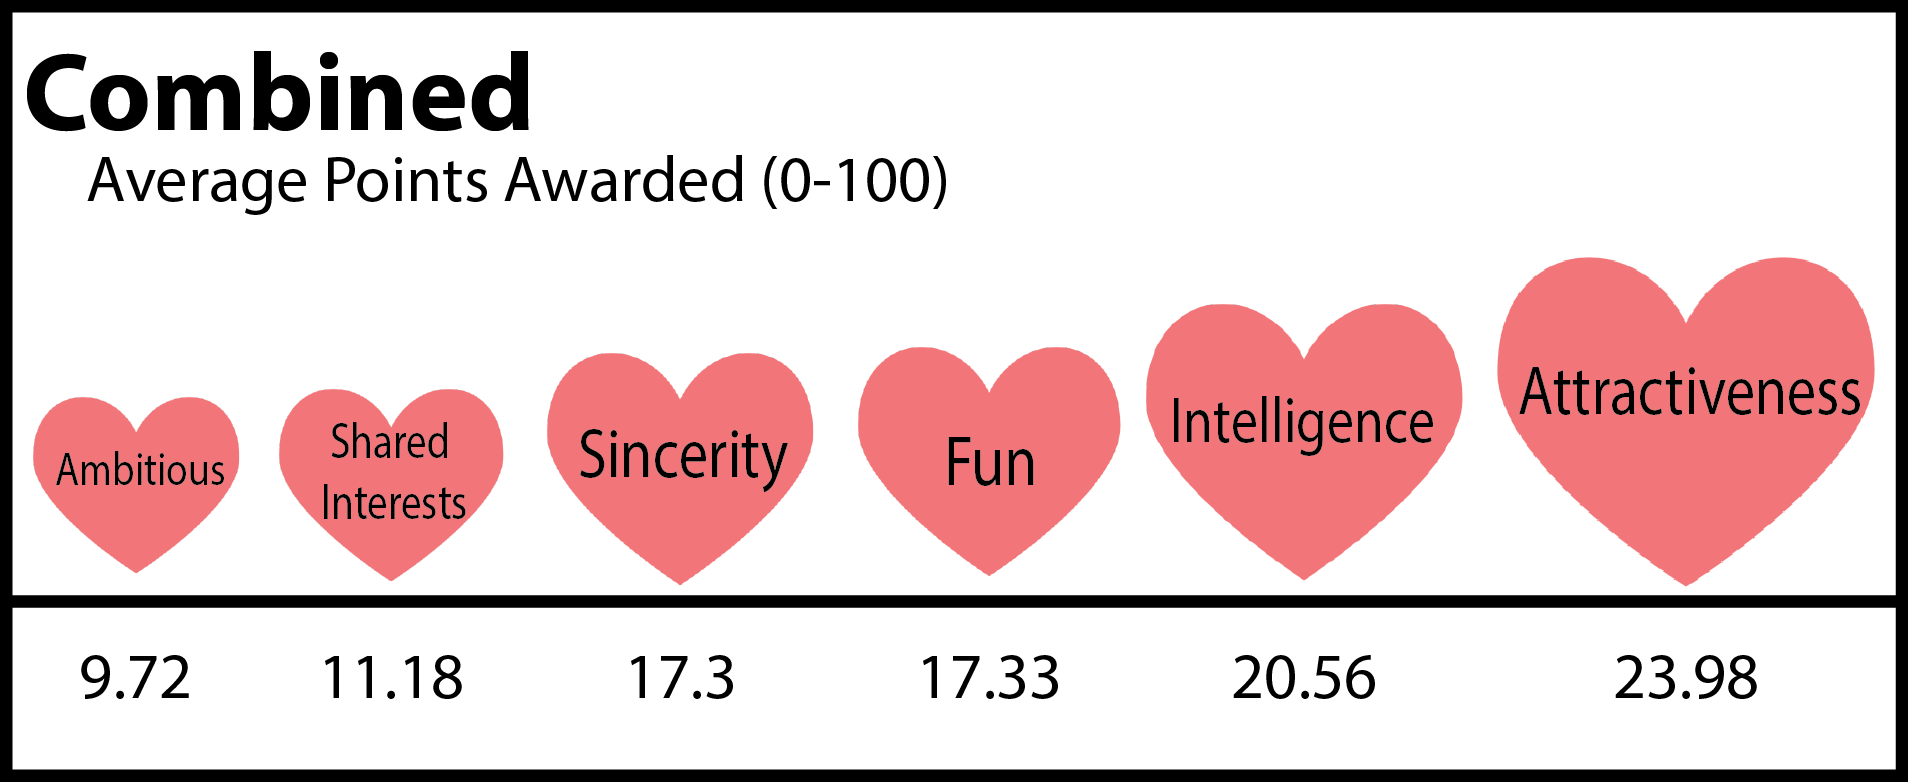
The best place to discover pattern differences between men and women in this process was by exploring matches and rankings as they relate to desired partner attributes. As aforementioned, participants ranked which attributes they most desired in a potential partner. They were given 100 points to distribute amongst 6 different attributes. They attributes were ambitiousness, attractiveness, intelligence, having shared interests and being fun. As you can see below, on average participants awarded ranked the attributes as most to least important in the following order: Attractiveness, Intelligence, Fun, Sincerity, Shared Interests and Ambitious.
However, this is not uniform for both males and females. When compared side by side you can see that women prefer intelligence most where as men prefer attractiveness. Women also show a greater desire for sincerity than men who consider being fun to be more important. Below you can compare the overall order of importance for each trait as ranked by men and women throughout the experiment.

Another interesting way to understand the difference between men and women rankings is to visualize the way in which they dispersed their points. With the charts below, you can compare where the dispersion of points per trait for men and women. As you can see below, women tended to rank each trait similarly with few outliers whereas men varied. Women also more evenly dispersed their points, averaging in around the teens and twenties for each trait. Men seemed to spread their points out disproportionate chunks, frequently rewarding more toward attractiveness and very few toward ambition.
Another necessary piece of analysis to consider is the differences in ranking between different age groups. Though the majority of participants ranged from 18 years old to 33 years old, there were still a significant number of older daters with potentially different expectations. To visualize this I quickly swapping the gender filter out of the above design for an age range filter. 18 to 25 year olds and 26 to 33 year olds valued the traits in the same order as the group over all with a slightly higher value of intelligence with older age. Participants ages 34 to 45 differed from the rest of the group as they valued intelligence higher than attractiveness.
Though these findings are interesting, do they predict the traits more frequently found in a match? Can daters recognize the traits they most desire in 4 minutes or are they jaded by surface level facts?
What makes up the most ideal candidate?
This is the final and concluding question I sought to answer. Which traits can one try to represent in order to maximize their amount of successful dates? To answer this question a comparison between the number of “yes’s” a candidate received and their individual rankings per attribute from their partner must be made. Upon comparison it is clear that though candidates ranked some attributes as less important than others, the higher they ranked their partner in each the more likely they were to select them. If their date portrayed a high level of each attribute they were interested in meeting them again. This was most obviously evident for attractiveness and fun, two traits that are easy to recognize in a short amount of time. On average, daters who scored above an 8 in those categories had a 70% yes rate. Traits like “sincere” and “ambitious” which are less recognizable in a short amount of time had lower yes rates per high score but still were directly correlated. An interesting exception to this noted by Fisman’s observations and slightly represented in my own is that intelligence, a category ranked highly by both men and women, had a slight drop off in “yes” ratings when daters scored a 9 or above. One explanation for this could be that only 26 participants scored that highly in intelligence skewing the data. However, Fisman believes that this is could be connected with the relatively low attractiveness ratings those 26 participants also received. I also constructed 6 different graphs and plotted the distribution of the scores per trait daters gave their partners against the rankings each dater distributed to each traits, which made a few findings clear. For all of the traits, daters most often distributed between 10 and 20 points out of 100 when deciding the importance of each (perhaps dreaming of a well rounded suitor). In most cases, those who equally distributed their points ranked their match at a 6 to 8 for each category. The highest ranked trait was Intelligence receiving a score of the most scores between 8 and 9 out of any, a trait that is one of the easiest to recognize during a first impression.
It is a pretty obvious fact that one would want to match with someone exemplifying higher levels of positive traits. However, that being said, there were still a number of people with high rates in certain categories that had low overall matches. What level of each attribute must a person have to make them desirable?
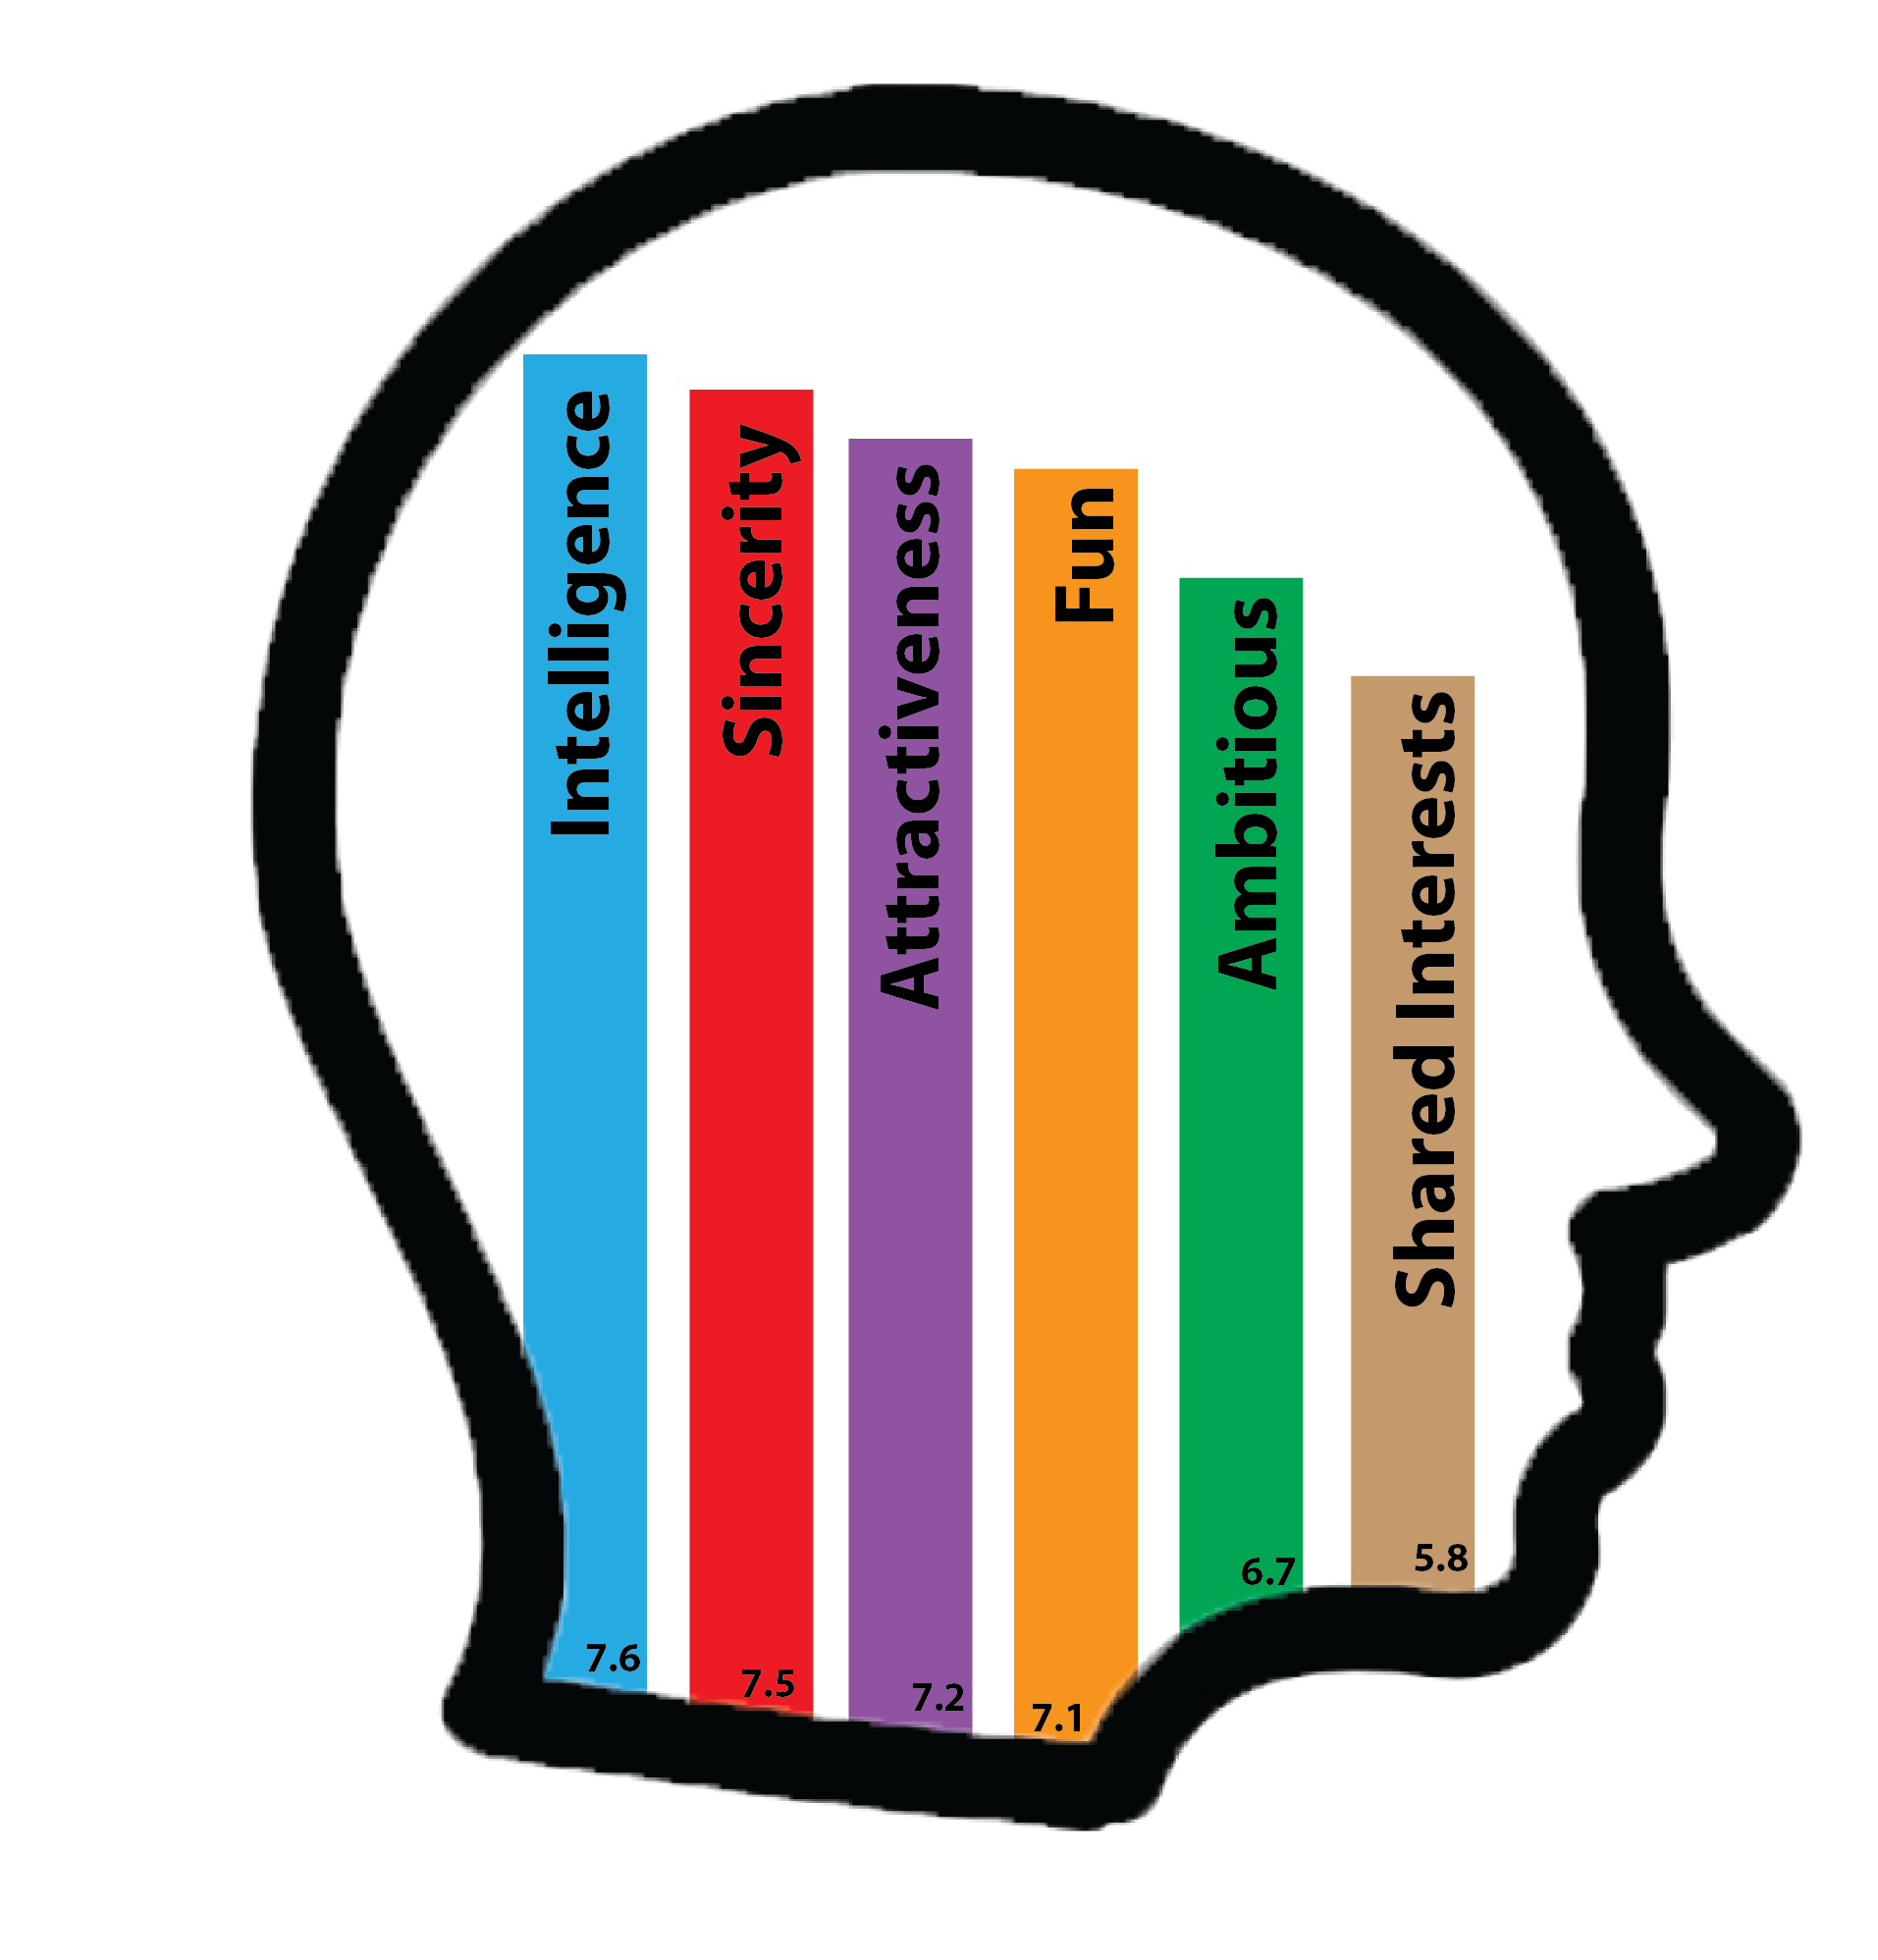 The above diagram shows the most common rankings per attribute that resulted in being selected. On average a selected candidate scored a 7.6 out of 10 for intelligence, 7.5 out of 10 for sincerity, 7.2 out of 10 for attractiveness, 7.1 out of 10 for fun, 6.7 out of 10 for ambitious and a 5.8 out of 10 for having shared interests. Comparing this to other analyses of the data, it seems that the traits that are less likely noticed within a short amount of time have heavy influence in yes ratings when they are actually noticed. As mentioned above, a quality like sincerity would be harder to notice in short conversations and thus overall resulted in lower yes ratings per high score than easily observable qualities like attractiveness. However, sincerity had one of the highest scores in the average “yes” candidate. It seems that in order to make the best impression in a short amount of time one should have an intelligent, sincere conversation and make sure they impress their partner with their looks.
To take a look at Robert Fisman’s analysis as well as his original dataset, key and metadata follow this link:
http://www.stat.columbia.edu/~gelman/arm/examples/speed.dating/